The top quark was the last of the standard model's six quarks to be discovered. It was first seen at Fermilab in 1995 by the CDF and DZero collaborations. The top quark is very massive for a fundamental particle, so much so that Fermilab's Tevatron proton accelerator remains the only place on earth where it can be created and studied. High energy physicists are eagerly studying the ever-growing data samples collected here in order to find out more about this fascinating particle.
The DZero collaboration's detector records the products of high energy collisions between protons and anti-protons in the accelerator. The data used in this measurement were collected over a period extending from mid-2002 through early 2004. Some of the collisions that occurred during this time produced a top quark and an anti-top quark together. Physical theory doesn't allow us to predict which of the trillions of collisions observed involved the generation of top quark pairs, but it does predict how often, on average, such pairs would have been produced. This rate is related to a theoretically derived quantity called the top-quark pair production cross section, from which the overall probability for the generation of top pairs can be calculated. This measurement tests that prediction by counting the number of times events consistent with top quark decays are observed in the collected data sample. This test of the theory governing top quark production is an important part of a suite of measurements aimed at expanding our still limited understanding of this recently discovered quark.
Top quark production is very rare compared to the many other processes that can occur when protons and anti-protons are made to collide. Sifting top decays out from the data therefore requires sophisticated analysis techniques. In general, these rely upon the presence of particular combinations of observed particles moving in particular ways with respect to one another. Since top quarks have very short lifetimes, they are not directly detected by the experimental apparatus. Rather, the particles that leave signatures in our detector are the products of top quark decays.
In the standard model, top quarks decay almost exclusively to a lighter quark and a W boson . The W is an unstable particle whose decay gives rise to several possible combinations of particles. This measurement concerns events in which each of the two Ws from a top pair in turn decays into leptons. Specifically, we look for an electron (e) or a muon (μ) and its associated neutrino (νe or νμ, respectively). Such an arrangement occurs in only about 5% of top-pair decays. However, these types of decays have the advantage of leaving a distinct signature in our detector. Electrically charged electrons deposit most of their energy into a section of the detector called the electromagnetic calorimeter while the more massive charged muons travel to the outermost parts of the detector, penetrating thick layers of iron along the way. In contrast, the electrically neutral neutrinos produced in the decays travel undetected through the experiment. Their passage is notable only as a significant imbalance in the energies of the detected particles. Of the many events collected by the experiment, we therefore consider only those containing any combination of two electrons or muons (i.e., ee, μ μ, or e μ), a significant energy imbalance, and two jets of particles consistent with those generated from the lighter quarks produced in top decay. Our criteria select only one collision for every trillion or so that occur in our detector.
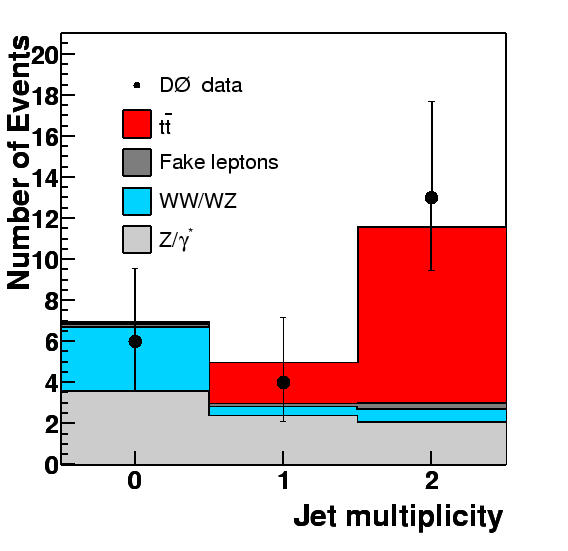
In order to compare the number of times our signature appears in the data to the prediction from theory, we must first estimate how often other processes (or backgrounds) are expected to give rise to events that pass our criteria. We make such an estimate using the standard model and detailed knowledge of our detector's response. The figure below shows a comparison of the events observed (represented by points with vertical bars spanning the statistical uncertainty of the observation) to the events expected from a combination of signal and background contributions (each source is represented with a differently colored bar graph - top signal is in red).

The counts are presented in bins corresponding to the presence of a different number of particle jets in a given event. The last bin, which corresponds to events having at least 2 jets, shows a clear excess of events above those expected from backgrounds (the non-red parts of the graph). The chance that these 13 events have come from statistical fluctuations in the backgrounds is around one in ten thousand. We use these events to compute a measured top production cross section of 8.6 picobarns. The picobarn (pb) is a unit used to measure cross sections. Our estimation of the summed uncertainty due to the limitations of our approach is 3.4 pb. When this uncertainty is considered, our measurement is quite consistent with the theoretically predicted cross section of around 7 pb.
If you would like to know more about the measurement, you can read the paper we have submitted for publication. You can also contact the primary authors (S. Anderson, C. Clement, B. Kehoe, J. Kozminski, J. Leveque, and P. K. Mal) directly.