Directly determined limits on the
Bs
meson mixing frequency
A
peculiar and extremely important property of neutral B mesons
is that
they can
spontaneously transform themselves into their own antiparticles
(and
visa
versa). This phenomenon, known as flavor oscillation or mixing, has
been
measured in the Bd system (a
bound state
of a b-antiquark and a d-quark),
but
remains to be
observed for Bs mesons (b-antiquark
and
s-quark bound states), which oscillate at a much faster frequency. One
of the
major goals of the DØ
experiment is to
measure the Bs oscillation frequency. This measurement will
provide
a crucial and unique test of our understanding of nature’s weak
force,
and could provide indirect evidence for new fundamental particles and
interactions.
|
|
|
Figure 1: The Bs
mixing "box diagram" (antiparticles are denoted by a bar above
their symbol). The Bs
meson, shown on the left, transforms (or oscillates) into its own
antiparticle by exchanging a W-boson (the wavy line) between its
constituent b-antiquark and s-quark, producing a top-quark
top-antiquark pair which quickly exchange another W-boson, producing a
s-antiquark and a b-quark: the antiparticle of the Bs. |
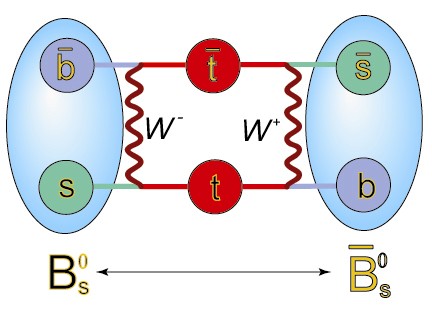
The
Bs meson mixes via the weak interaction between its own
constituents.
This process (shown in Figure 1), involves the exchange of a W-boson
between
the original b-antiquark and s-quark which
produces a
top, anti-top quark pair, which is almost immediately transmuted by
another W-boson
exchange into a b-quark and s-antiquark pair (an anti-Bs meson). The rate
at which this transformation occurs is characterized by the mass
difference between
the two quantum states of the meson, called Δms. We know, from previous experimental
attempts to
measure this
frequency, that Δms is
greater
than 16.6 ps-1 (16.6 trillion times a second).
The
Standard
Model of particle physics predicts that Δms
is between 16.7
ps-1 and 25.4 ps-1.
It is
extremely
difficult to measure oscillations this rapid. Bs mesons are
unstable
and quickly decay into lighter particles. They travel at most a
millimeter
or two before they decay, and we must measure this distance very
precisely. A
precision on the order 10's of microns is needed to be able to
measure
the mixing frequency. We also must
determine the momentum
of the meson by detecting as many of its decay
products
as possible. Finally, in order to see if a Bs meson has
mixed, we must
determine its flavor (whether or not it is a particle or antiparticle)
at both
the time it was produced and when it decayed. Its flavor at decay time
is
determined by the charge of its decay products. Since b-quarks and b-antiquarks are almost always produced in pairs
in
collisions at the Tevatron, the B meson's
flavor at
production can be determined by a partial reconstruction of its partner
b-hadron which is on the opposite side of the
event. We used our large
samples of hundreds
of thousands of reconstructed B mesons to optimize and calibrate this
opposite
side flavor tagging procedure. We have measured the well known Bd meson oscillation frequency using
this flavor
tagging and obtain the correct result. This gives us confidence that
our flavor
tagging and other techniques are sound, so we move on to attempt a
measurement of Bs
mixing.
|
|
|
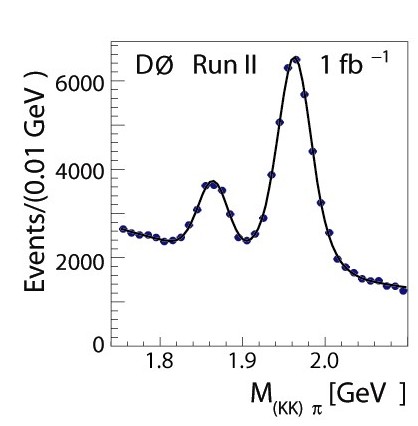
Figure 2: Invariant mass
distribution of the kaon-kaon-pion system.
The peak on
the right correspond to the decay of Ds mesons. There are 27,000
events above background in this mass region. |
In this
analysis,
we look for events in which the Bs decays into a Ds
meson
(a c-antiquark, s-quark bound state) plus a
muon
and
a neutrino.
We choose this decay mode because it has a muon in the
final state
which is easy to detect and rarely produced in high energy
particle
collisions. This allows us to pick out (or “trigger” on) these type
of events from the millions of collisions per second produced by the Tevatron. Using
this
decay mode comes at a price, however, as the neutrino passes through
our
detector without leaving a trace. This makes the determination of the Bs
momentum less precise as we are missing one of its decay products. The Ds meson is also unstable and
decays
into a phi
meson plus a pion in a short
period of
time. The phi meson decays immediately in two kaons.
We look for three particle tracks in our
detector near the muon and add up their momentum in a relativistic
manner
determining the invariant mass of the system. If the particles are from
the
decay of a Ds meson, their invariant mass should equal the
rest mass
of the Ds. The invariant mass
distributions in our data for this selection are shown in Figure 2. The
large peak on the
right corresponds to Ds decays. After
four years of taking data, we have
reconstructed twenty seven thousand Ds mesons in this decay
mode.
Most of these are from Bs decays, and in six thousand of
them we are
able to
determine the initial flavor of the Bs. The intersection of
the
reconstructed
Ds flight path with that of the muon gives us the distance
the Bs meson
traveled
before it decayed. This, along with its momentum measurement (how fast
it was traveling), gives the lifetime of the Bs meson.
|
|
|
Figure 3: This plot shows the "amplitude scan" of the mixing frequency of our data. For each value of Δms (horizontal axis) an amplitude value A (vertical axis) is determined (the yellow and green bands represent the uncertainty in this determination). The value of A should be one (shown as a red line) if the data are compatible with the given mixing frequency, and zero otherwise. The data clearly deviates from zero around for values of Δms around the peak at 19 ps-1 indicating the presence of oscillations with frequencies in the range where the uncertainty band is above zero. |
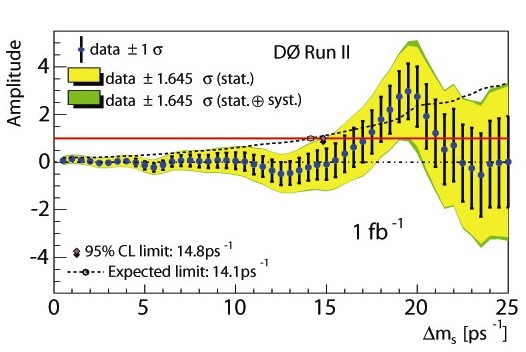
The
probability
for an initial Bs meson to mix and decay as an anti-Bs
meson
as a
function of its lifetime (t) is proportional to a simple
mathematical
form 1-Acos(Δms
t). The probability for it to not oscillate is
proportional
to 1+Acos(Δms t). For a perfect detector
and flavor
tagging algorithm, A (the amplitude) would be equal to 1. Of course, nothing is perfect, but we know
our
detector and algorithms well enough to correct for their
inefficiencies and resolutions. We perform a sophisticated multi variable
mathematical fit of our data taking these corrections into account and
determine the amplitude and its
uncertainty
for various values of Δms;
scanning
from
0 to 25 ps-1. The
amplitude should be zero (within
uncertainties) for the incorrect values of Δms
and
then peak at 1 (within uncertainties) for the correct value. As you can
see in
Figure 3, the “amplitude scan” shows a peak in the amplitude for
values of Δms
around 19 ps-1,
indicating
the presence of oscillations at (or near) this frequency.
In
order to pin
down the oscillation frequency more precisely we perform an even more
refined fit to the data. Again a scan of Δms
is
performed, but in this fit the amplitude A
is set equal
to 1. The fit returns a probability or “likelihood” that
the data fits the mixing probability functions. The results of this
procedure
tell us that the most likely value of Δms
is
19 ps-1 and
more importantly that Δms
is in the
range
17 < Δms
< 21 ps-1
at the 90%
confidence level. This is the
first directly determined range for the Bs oscillation
frequency, and
it fits
quite well within the Standard Model predictions. It
is still, however, very important that we
make a precise measurement of the Bs oscillation frequency.
We are
already
working on improving our analysis by using more Bs decay
modes,
developing additional
flavor tagging algorithms, and adding a more precise inner
particle
tracking
detector.
An article on this
analysis has
been submitted to Physical Review Letters in March 2006.
For more information on this analysis please contact the DØ Bs mixing group via the physics
coordinator.